Easy-to-understand updates on climate change by NPO Speedy Land Trust

The NPO Speedy Land Trust has been established and is preparing diligently.
In March, we will launch our official website, and now we would like to finally get down to brass tacks.
I always get regular status updates from my partner and co-chair, Ian Shimizu.
When I talk about global warming, some people say that it is a myopic view that the earth is warming and that we are heading for an interglacial period from a macroscopic viewpoint. Here is what NASA has to say.
Note the three data below.

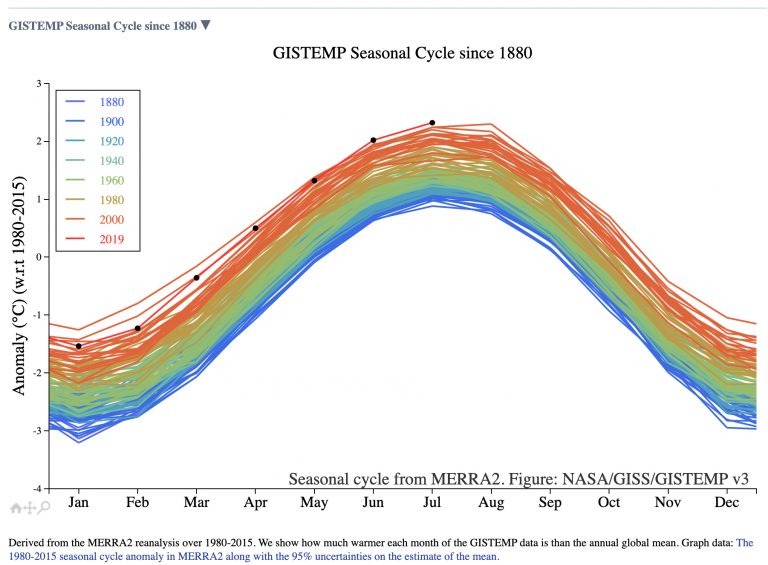
1. GISTEMP Seasonal Cycle since 1880
A graph tracking the average temperature of the Earth’s surface each month for the 140 years from 1880, considered pre-industrial, to 2019.
As you can see, it has increased from blue (1880) to red (2019). Earth’s temperature has definitely increased by about 2 degrees Celsius over the past 140 years. (Data source: NASA GISS)
https://data.giss.nasa.gov/gistemp/graphs_v3/

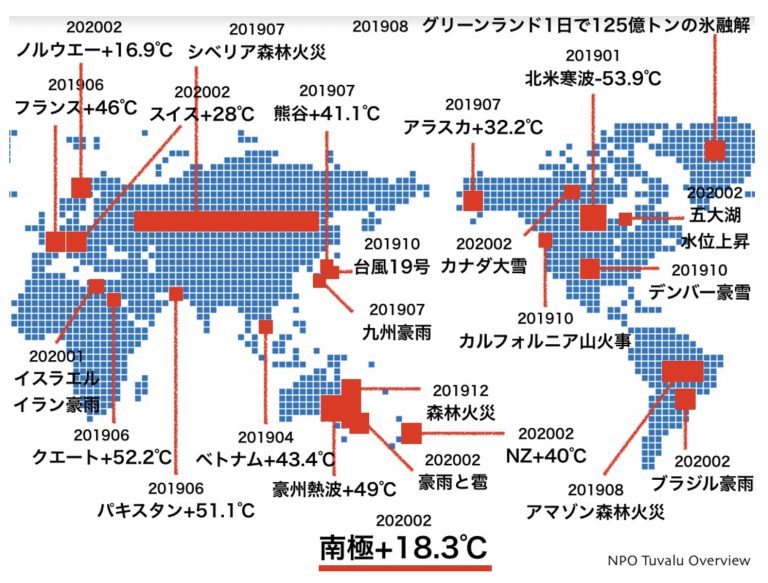
2. NPO Tuvalu Overview
Slide visualizing extreme weather and natural disasters in 2019
http://www.tuvalu-overview.tv/
3. Global Temperature Anomalies from 1880 to 2019
Visualizations by Lori Perkins Released on January 15, 2020
According to the National Oceanic and Atmospheric Administration, 2019 was the second hottest year on record. That is.
A video showing it at a glance was posted on the NASA website on January 15.
Incidentally, the five major institutions in the world that study the atmosphere (see below) agree that global temperatures are rising.
NASA, NOAA, the Berkeley Earth research group, the Met Office Hadley Centre (UK), and the Cowtan and Way analysis
https://svs.gsfc.nasa.gov/4787
4. Annual Arctic Sea Ice Minimum 1979-2019 with Area Graph
Visualizations by Trent L. Schindler Released on January 10, 2020/ NASA
Animation about the “minimum sea ice extent” in the Arctic. The minimum sea ice extent is the time when there is the least amount of ice on the ocean (sea ice).
NASA has been tracking Arctic sea ice extent since about 1970. It can be seen that the sea ice in the Arctic is extremely decreasing.
https://svs.gsfc.nasa.gov/cgi-bin/details.cgi?aid=4786&button=recent


